
Nutrition facts
Calories in a cucumber
The vegetable with the most water in this collection, and the one weighed least often: it gets sliced by eye until there is none left.
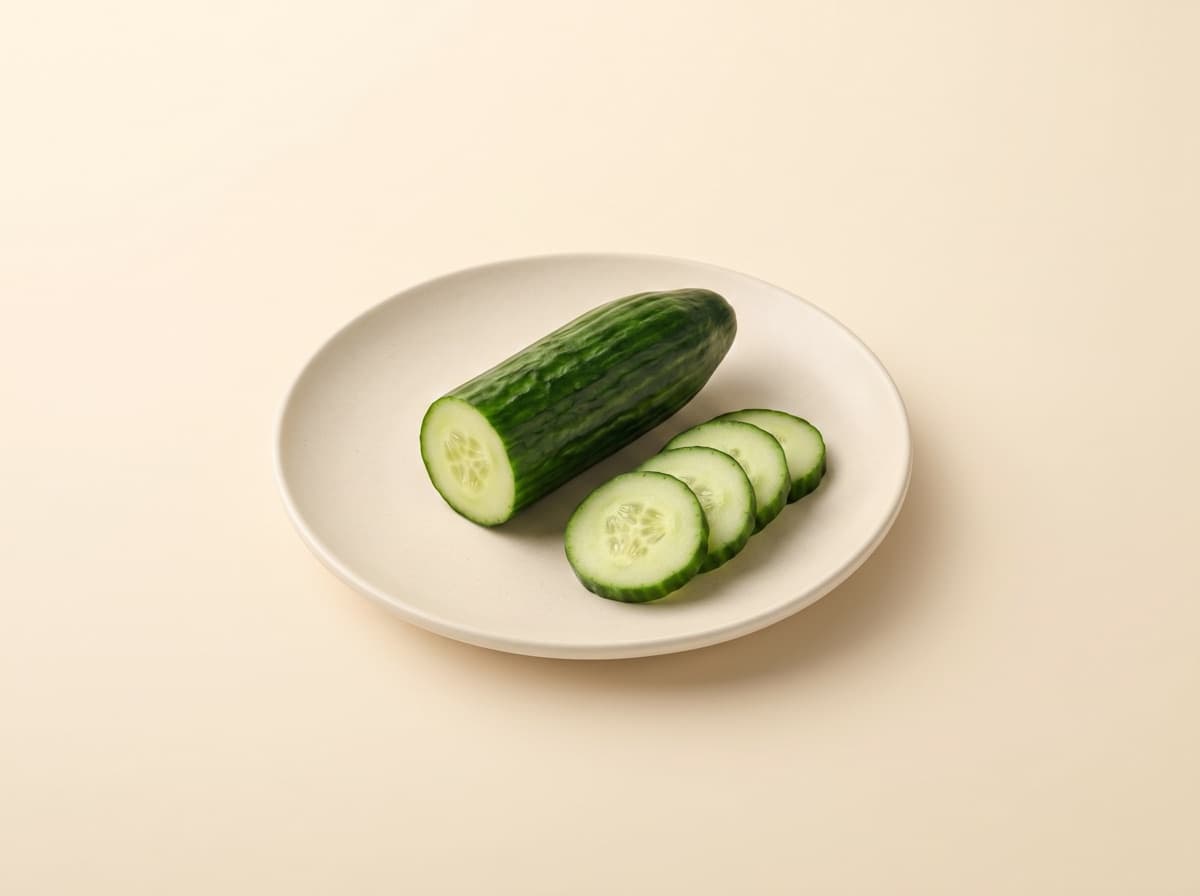
What a real portion weighs
The Anses table gives values per 100 grams, and 100 grams is not a portion anybody serves. Here are the same values, applied to the portions as they turn up. Weights are in grams, the unit the table is built on. For a quick conversion: 1 oz is about 28 g, and 1 lb is about 454 g.
| Portion | Weight | Energy | Protein | Carbs | Fat | Fiber |
|---|---|---|---|---|---|---|
| Half a cucumber · flesh and skin | 150 g | 25 kcal | 1 g | 4.3 g | 0.2 g | 0.8 g |
| A serving of slices | 100 g | 17 kcal | 0.7 g | 2.9 g | 0.1 g | 0.5 g |
These weights are usual orders of magnitude, not standardized measures: they turn a per-100-gram value into a credible portion. A kitchen scale stays more accurate than any average weight.
Composition per 100 grams
Cucumber, flesh and skin, raw
- Energy
- 17 kcal
- Protein
- 0.7 g
- Carbohydrate
- 2.9 g
- of which sugars
- 1.7 g
- Fat
- 0.1 g
- Fiber
- 0.5 g
- Sodium
- 5 mg
What a table of values does not say
- Water makes nearly all of the weight: the cucumber brings volume and crunch and almost nothing else, which is exactly its job in a salad.
- With or without the skin, the difference is a matter of taste: the skin carries the bitterness and not much else.
The Zemiam recipes that use it
These pages carry their calories and their macros, recalculated from the same table as this one. The weight given is that of the ingredient in one serving.
- Quinoa salad with chicken, cucumber and feta · 60 g per serving
- Cheese omelet with tomato and cucumber · 80 g per serving
- Quinoa salad with feta and cucumber · 100 g per serving
- Quinoa tabbouleh with tomato and cucumber · 80 g per serving
What comes after the number
How much to eat in a day
A portion means nothing without the day that holds it. A calorie need is worked out from height, weight, age and activity level, then split into protein, carbohydrate and fat.
Calorie calculatorWhere body build sits
Body mass index, the full WHO classification, and the weight range matching a normal build for a given height.
BMI calculatorNeighboring pages
An average weight is an estimate. A photo is not.
In Zemiam, a photo of the meal is enough to log the real portion, with the composition of this same table rather than a guessed figure.
Where the values come from
The composition comes from the Anses Ciqual table: Anses. 2025. Table de composition nutritionnelle des aliments Ciqual, published under Licence Ouverte 2.0. The per-100 g values are reproduced without being altered; the per-portion values are those same values multiplied by a weight, and that weight is not an Anses figure.
The same page in French: Calories du concombre.