
Nutrition facts
Calories in butter
The fat of the French breakfast, whose dose is decided by the knife: ten grams show, five go unnoticed.
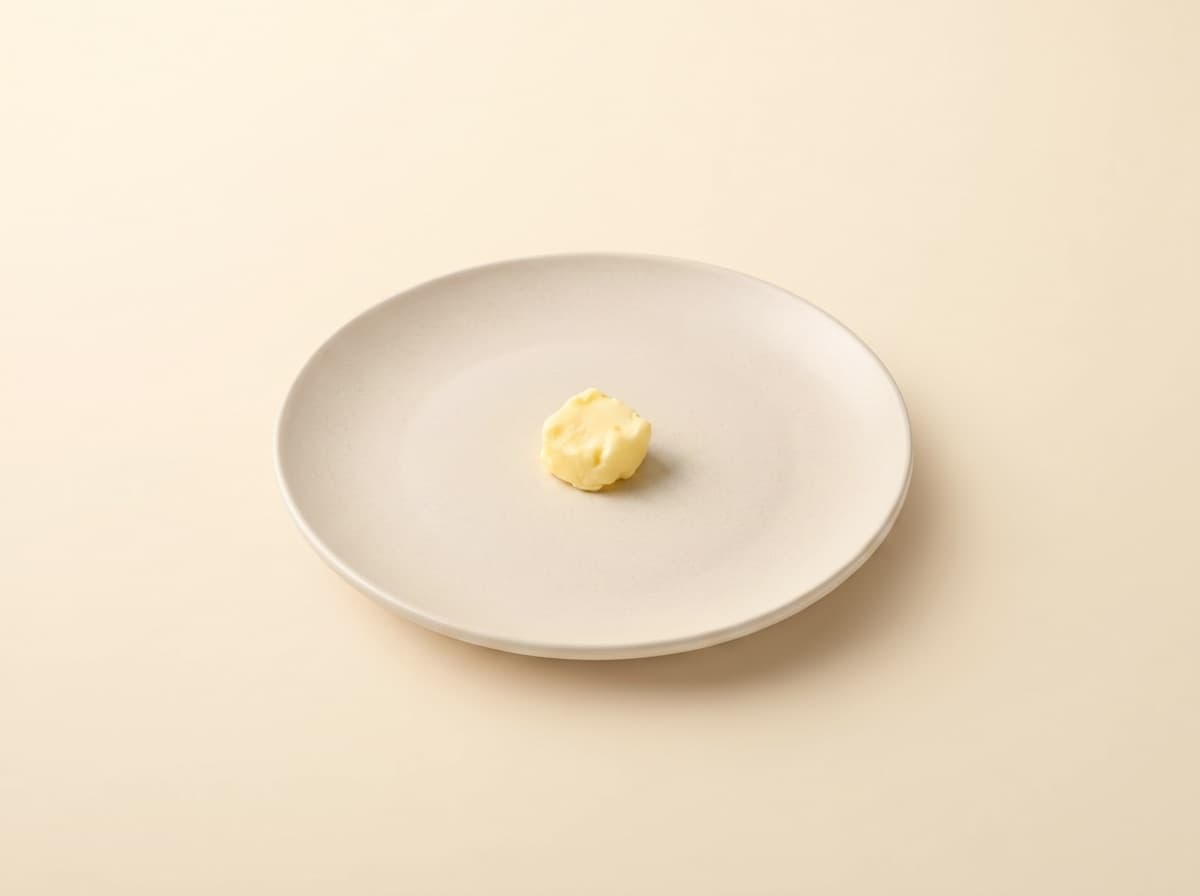
What a real portion weighs
The Anses table gives values per 100 grams, and 100 grams is not a portion anybody serves. Here are the same values, applied to the portions as they turn up. Weights are in grams, the unit the table is built on. For a quick conversion: 1 oz is about 28 g, and 1 lb is about 454 g.
| Portion | Weight | Energy | Protein | Carbs | Fat | Fiber |
|---|---|---|---|---|---|---|
| A slice of toast's worth | 10 g | 75 kcal | 0.1 g | 0.1 g | 8.3 g | 0 g |
| A knob | 5 g | 38 kcal | 0 g | 0 g | 4.2 g | 0 g |
| A whole block | 250 g | 1,883 kcal | 1.6 g | 1.8 g | 207.5 g | 0 g |
These weights are usual orders of magnitude, not standardized measures: they turn a per-100-gram value into a credible portion. A kitchen scale stays more accurate than any average weight.
Composition per 100 grams
Butter, 80% fat minimum, unsalted
- Energy
- 753 kcal
- Protein
- 0.6 g
- Carbohydrate
- 0.7 g
- of which sugars
- 0.7 g
- Fat
- 83 g
- Fiber
- 0 g
- Sodium
- 14 mg
Butter vs extra virgin olive oil
Two fats, two constitutions: an oil carries nothing but fat, while butter carries its water too. The gap shows it at equal weight.
| Food | Energy | Protein | Carbs | Fat | Fiber |
|---|---|---|---|---|---|
| Butter | 753 kcal | 0.6 g | 0.7 g | 83 g | 0 g |
| Extra virgin olive oil | 899 kcal | 0.3 g | 0 g | 99.9 g | 0 g |
Weight for weight, butter: 16% less energy.
What a table of values does not say
- The difference between a light spread and a generous one is measured with the knife, not by eye.
- Salted or unsalted, the table separates only the salt: the fat is the same.
The Zemiam recipes that use it
These pages carry their calories and their macros, recalculated from the same table as this one. The weight given is that of the ingredient in one serving.
- Buttered toast with jam and a glass of milk · 15 g per serving
- Soft-boiled eggs with toast soldiers · 10 g per serving
- Pancakes with maple syrup · 10 g per serving
- Hot chocolate with buttered toast · 10 g per serving
- Homemade beef lasagna · 10 g per serving
- Croque monsieur with green salad · 10 g per serving
- Crepes with sugar · 10 g per serving
- Ham and butter baguette with pickles · 15 g per serving
- French onion soup · 15 g per serving
- Beef bourguignon with potatoes · 10 g per serving
- Veal blanquette with rice · 10 g per serving
What comes after the number
How much to eat in a day
A portion means nothing without the day that holds it. A calorie need is worked out from height, weight, age and activity level, then split into protein, carbohydrate and fat.
Calorie calculatorWhere body build sits
Body mass index, the full WHO classification, and the weight range matching a normal build for a given height.
BMI calculatorNeighboring pages
An average weight is an estimate. A photo is not.
In Zemiam, a photo of the meal is enough to log the real portion, with the composition of this same table rather than a guessed figure.
Where the values come from
The composition comes from the Anses Ciqual table: Anses. 2025. Table de composition nutritionnelle des aliments Ciqual, published under Licence Ouverte 2.0. The per-100 g values are reproduced without being altered; the per-portion values are those same values multiplied by a weight, and that weight is not an Anses figure.
The same page in French: Calories du beurre.